Conference Abstract: Movement to Move
Results from Bulgaria’s 2018 Report Card on Physical Activity for Children and Youth
List of Authors:
Bilyana Mileva, BG be Active Association, Plovdiv, Bulgaria; Mileva (bilyana@bgbeactive.org) is corresponding author
Introduction
In Bulgaria, the period of transition (1989-1998) from Communism to Democracy, and the two decades that followed, witnessed broad social and economic changes. The transition to a market-based economy was accompanied by less regular Physical Activity and Organized Sport, viewed as unaffordable luxuries by large segments of the population whose standards of living were going down. There is limited data to accurately estimate the situation in the country. The 2018 Report Card is a summary of the best available data on physical activity among Bulgarian children and youth.
Methods
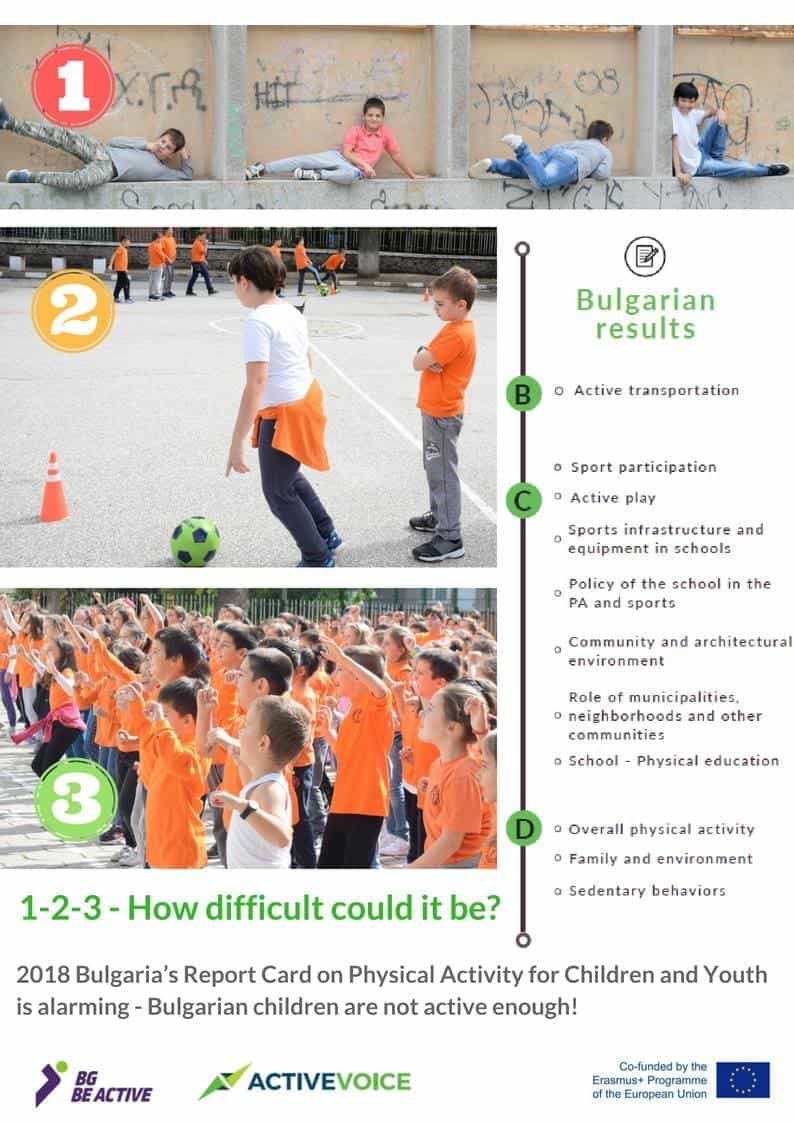
Bulgaria’s 2018 Report Card (Figure 1) summarizes the limited data, available on the physical activity levels of Bulgarian children and youth such as Eurostat 914 Barometer or UNICEF Health Behavior in School-aged Children and other national sources. However, facing this insufficiency, disparity and incomparability of existing data, the core of Bulgaria’s 2018 Report Card was informed by a survey of 1014 Bulgarian children aged 6 to 18 years and their parents based on the Physical Activity Indicators that are common to the Global Matrix 3.0.
Results and Discussion
Table 1 presents results from Bulgaria’s 2018 Report Card. As a post-communist country2 with high regard for competitive sport, we see high levels of children’s participation in Organized Sport (grade C+) in Bulgaria. The proportion of children who participate two or more times per week in Organized Sport is 70% (in and out of school). Contrary to that, only 30% of the Bulgarian children (6-18) meet the recommended daily minimum of 60 minutes of moderate-to-vigorous intensity physical activity, while 70% of the students spend more than 2 hours in front of a recreational screen. Specific groups (children from ethnic minorities or with financial difficulties) demonstrate higher levels of inactivity and sedentary behaviour.
Conclusion
The high levels of inactivity and sedentary behaviour are a natural consequence of the gaps in governmental and local policies and insufficient funding. However, inactivity levels can be associated with cultural specifics of Bulgarians and there is an urgent need of updated programmes for Physical Education.
Table 1: Grades and rationales for Bulgaria’s 2018 Report Card
| Indicator |
Grade |
Rationale |
| Overall Physical Activity |
D+ |
Approximately one third (30%) of children and youth aged 6 to 18 years, meet the recommended daily minimum of 60 minutes of physical activity. If the 5 percent declaring engaging in such activity for at least six days a week is added, the total proportion of children and youth meeting the guidelines will be approaching 35%. |
| Organized Sport Participation |
C+ |
60% of children and youth participate in Organized Sports at school while 56% engage in Organized Sports out of school. The proportion of children and youth engaging in Organized Sport at least 3 or more times per week is almost similar in and out of school (27% and 29% respectively). The proportion of Bulgarian children and youth meeting the LISPA Group recommendations is 70%. |
| Active Play |
C+ |
55% of children aged 6-18 year have outdoor activities for 3 or more days weekly, and the proportion is higher (63%) when considering only those aged between 6 and 15 years. |
| Active Transportation |
B- |
53% of children and youth reported walking, biking, or skating, etc. to go to school and back. The Bulgarian Active Kids Survey considered two aspects (means of transportation and time it took to school) of the active transportation of children and youth. Since we found that for approximately 16%, it takes less than 5 minutes to get to school, when evaluating the active transportation we took a conservative approach and excluded this group. If this group is included in evaluation, then the proportion increases to 64%. The Grade B was awarded because the research does not take into account other locations that can reach using active transportation. |
| Sedentary Behaviours |
D |
Approximately 70% of children and young people in Bulgaria spend two or more hours sitting in front of a recreational screen, tablet, and 75% reported spending two hours or more in other sedentary activities. Only 16% of children spend less than one hour in front of a recreational screen, while 15% spend more than 6 hours seated. Another 40% of children spend over five hours a day in the two types of sedentary behaviour. |
| Physical Fitness |
INC |
There was not sufficient data to grade this indicator |
| Family and Peers |
D |
Approximately 25% of Bulgarian families practice sports for two or more times a week. One third of the families, report that they sports facilities and/ or other sports equipment at home. Almost one third of families, finances the sporting activities for their children, while about 1/3 of families, reported that they never exercise. Only 9% of children indicate that all their friends are practicing some sport, while another one third declare this for about half of friends. The proportion of students whose friends engage in sports for two or more times a week was 43%. |
| School |
C |
This indicator was graded based on the children and their parents’ assessment of the quality of teachers and classes on physical education and sport, formal requirements, content of curricula, duration of hours. In addition, expert opinion was also used. 50% of parents and children firmly assess their school’s sport hall and facilities as very good. 55% declare that the sport hall facilities were renovated during the last two years. Based on this overall positive assessment of sporting equipment and outdoor facilities that encourage physical activities at the schools, as well as expert opinion, the indicator was assigned a grade C. |
| Community and Environment |
C |
A conservative approach was used. Although about 65% of children and youth declare that they have easy access to the nearest playgrounds and 63%, to parks with sports facilities. The assessments of the other elements of a supportive community environment are significantly lower: 41% for bicycle paths, 33% for running grounds, and 30% for swimming pools. The overall positive assessment of the state of these facilities is 45%, and of the various aspects of their safety is between 50 and 60%. |
| Government |
INC |
Invitations and questioners were sent to different government official in local (municipal), regional, and at the national level (Ministry of Youth and Sport) but no official answers were returned. Because of our failure to obtain information, this indicator was assigned an incomplete grade. |
